Over-complicating my blog's infrastructure by building a custom analytics pipeline
Towards the end of last week, as I was reading this post by the Homebrew folks, one particular line about their self-hosted analytics pipeline nerd-sniped me into setting something similar up for this blog. It’s not like I need one; I didn’t even have analytics up until a couple of weeks ago, and that showed me I don’t get nearly enough hits to justify it; but this is just good fun.
I should mention that if you’re looking for a straight-forward solution, I highly recommend Plausible. I’ve used them in the past and their infrastructure is solid. Plus they aren’t as invasive as Google Analytics, and don’t sell your visitors’ data to advertisers. You can self-host too!
That being said, I think my setup’s pretty cool too! Because web analytics can often be a one shot, fire-and-forget kind of deal (losing a few events to network failures is no biggie), I can get sub-100ms round-trip latencies from pretty much anywhere in the world:
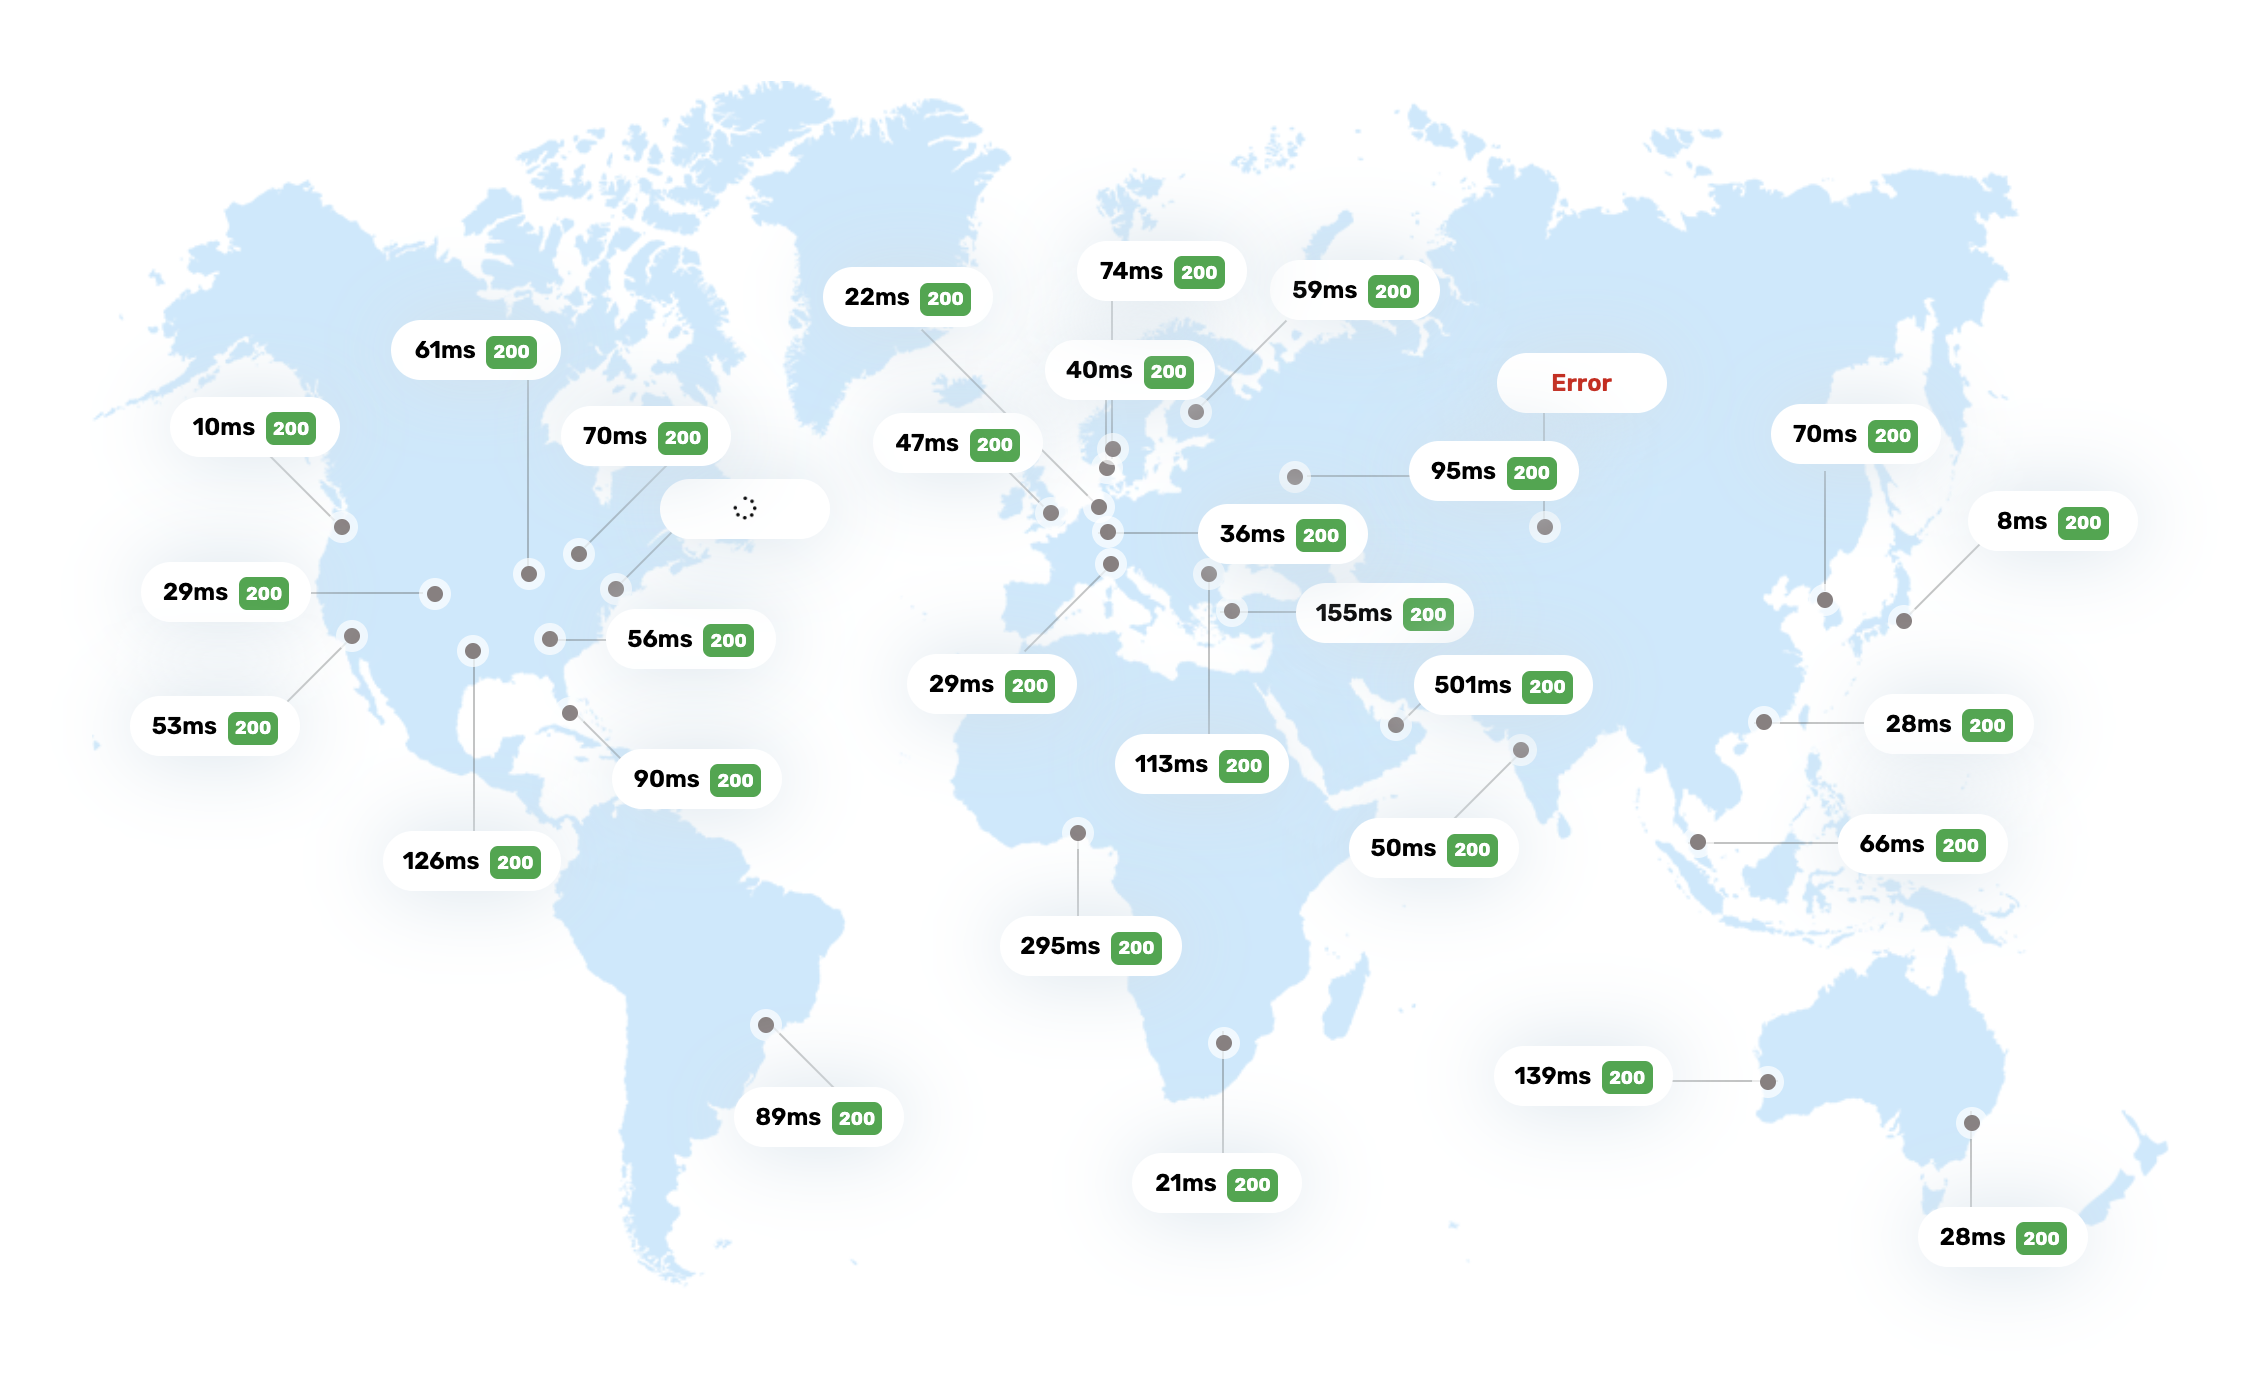 (I used Bunny’s HTTP connectivity test tool
to generate this map)
(I used Bunny’s HTTP connectivity test tool
to generate this map)
There are three parts to my setup:
- A Hetzner server hosted in Falkenstein, Germany. It runs InfluxDB, Telegraf and Grafana.
- A
cloudflaredtunnel connecting this server to Cloudflare’s network. This tunnel is protected from scheming Internet goblins using Cloudflare Access. - A Worker that exposes an HTTP endpoint that this blog (and hopefully others in the future) will send out
page_viewevents to.
My control plane looks like this:
All in all, this costs me €10.66 a month, and all of that is just the cost of the server itself. This setup also isn’t limited to analytics. I fully plan on reusing this for metrics, logs & traces (basically any kind of time-series data) for any current and future projects.
Writing about how exactly I set everything up is going to take a herculian effort and I’m not sure if that’d be very interesting to read, so I’m going to instead go over each piece, talking about how it fits into the overall setup. Let’s go!
The server
Since this server is going to be running InfluxDB, Telegraf and Grafana, I thought it’d be a good idea to get something with a little more juice than my VPS provider’s base-level machine, because these things can all be resource hogs.
In the past I would have chosen Linode, but that doesn’t exist anymore ¯\_(ツ)_/¯ so I’m going with Hetzner. So far I’m extremely impressed. Their servers are quick to spin up and it’s also one of the few VPS consoles that doesn’t feel like it was built in 1994 with ASP.net or some shit. All to say it loads quick and has UX designed for humans.
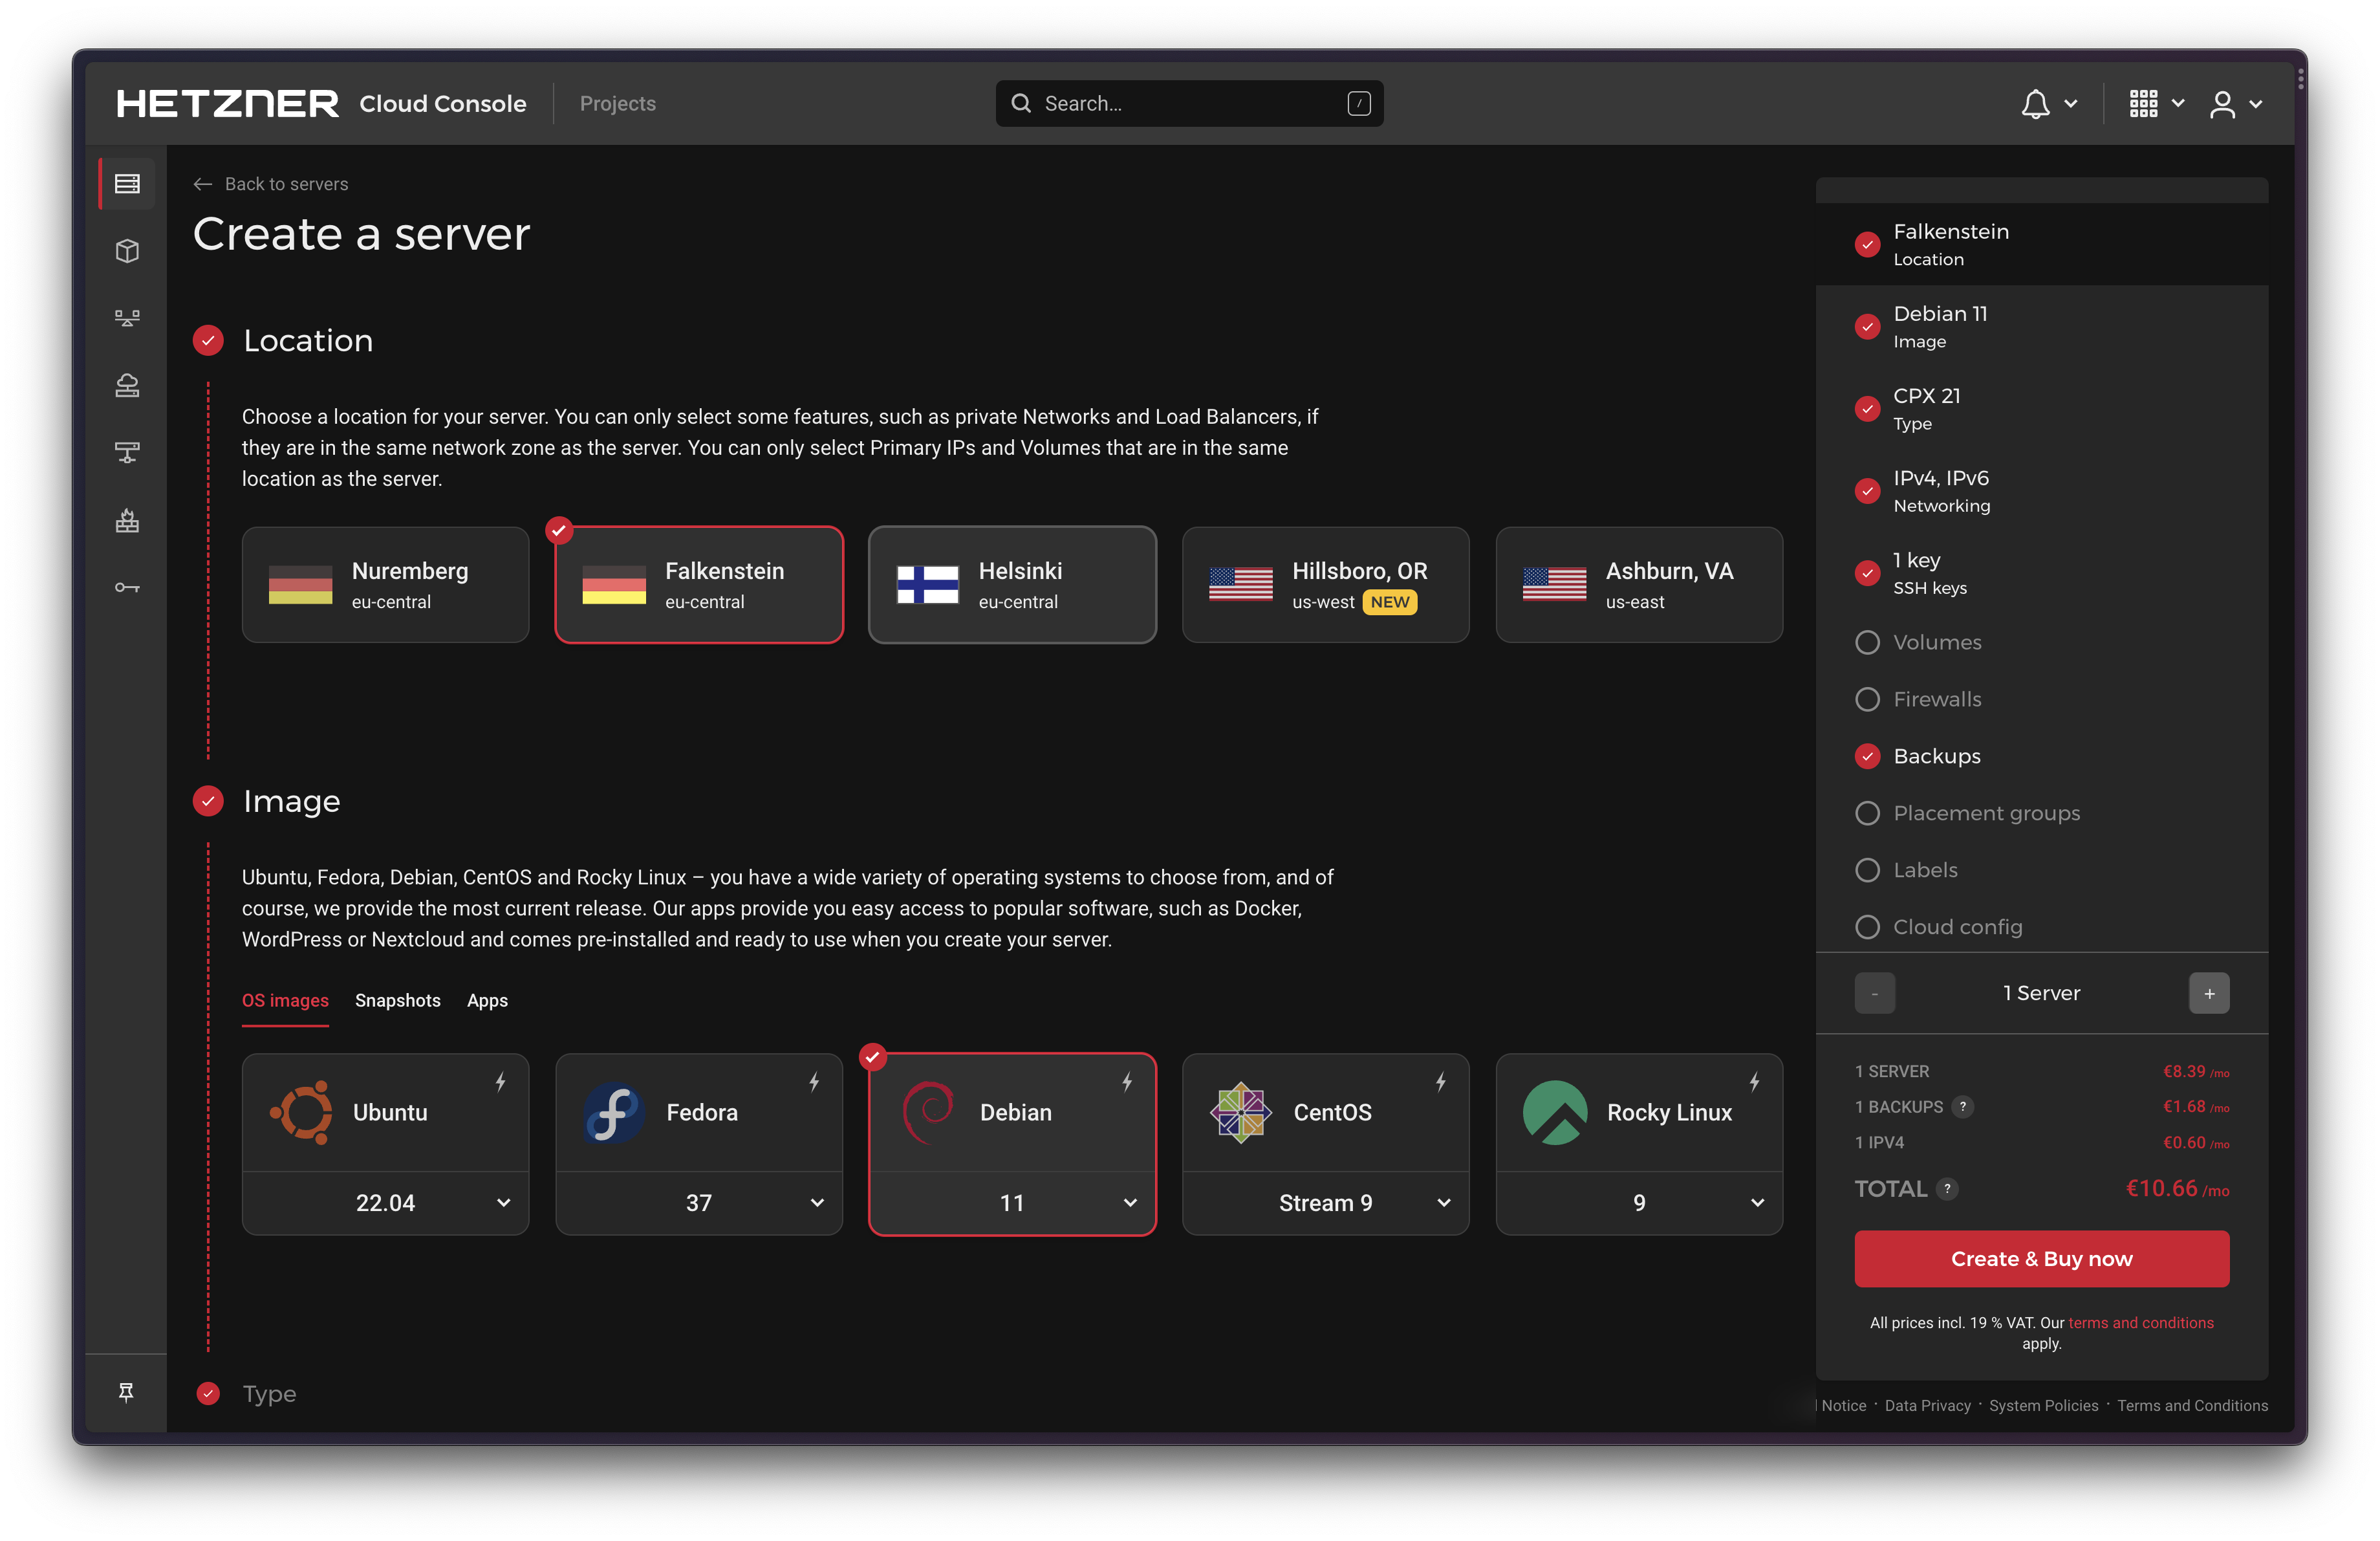
I spun up a Debian 11 server, enabled daily backups, and set up basic security:
- Created a non-root user
- Set up SSH access via public key authentication for this user
- Disabled root logins via passwords
- Installed and configured
unattended-upgrades(for automatic system upgrades),fail2ban(to automatically ban IPs failing to log in) andufw(to close all ports except22for SSH)
Here’s a quick tip: If you stop and snapshot this machine right now, you can spin up servers with these basic things ready to go in a single click. That’s what I’ve done! Hetzner literally calls these Snapshots, but any serious VPS provider will have ways to do this. Snapshots cost a few cents / GB a month, and at this point your machine is likely less than a gigabyte in size, so it is more than worth it.

Next up on the list was setting up a (time series) database. I’ve seen Prometheus set up at work, but honestly it’s just super intimidating to me. I wanted something a bit more modern, so I set up InfluxDB instead (I guess their podcast ad spots worked).
Getting it up was a breeze, their docs
make it easy to set influxd up as a systemd service. I also recommend installing
the influx CLI, and using it to initialize your database, for two reasons:
- I noticed that this generates the
defaultprofile correctly, but the UI didn’t, which is kinda important. ufwstops you from accessing the UI in the first place because it blocks the default:8086port.
Time to get some data into InfluxDB so I can play around with it a little. I had seen Telegraf making the rounds on HN a few weeks ago, and turns out I had totally misunderstood what it actually was. I thought it was more of a system monitor, but it is actually a “collector”. It is made by the InfluxDB folks, and in a nutshell, is an agent that runs on your server that can take in large amounts of inputs, and then efficiently push them to an output database of your choosing.
That sounds vague, and for good reason, it has a bunch of builtin input and output plugins, so it can basically take in data from anywhere and push it anywhere. I’ve found that it works great as a proxy for InfluxDB.
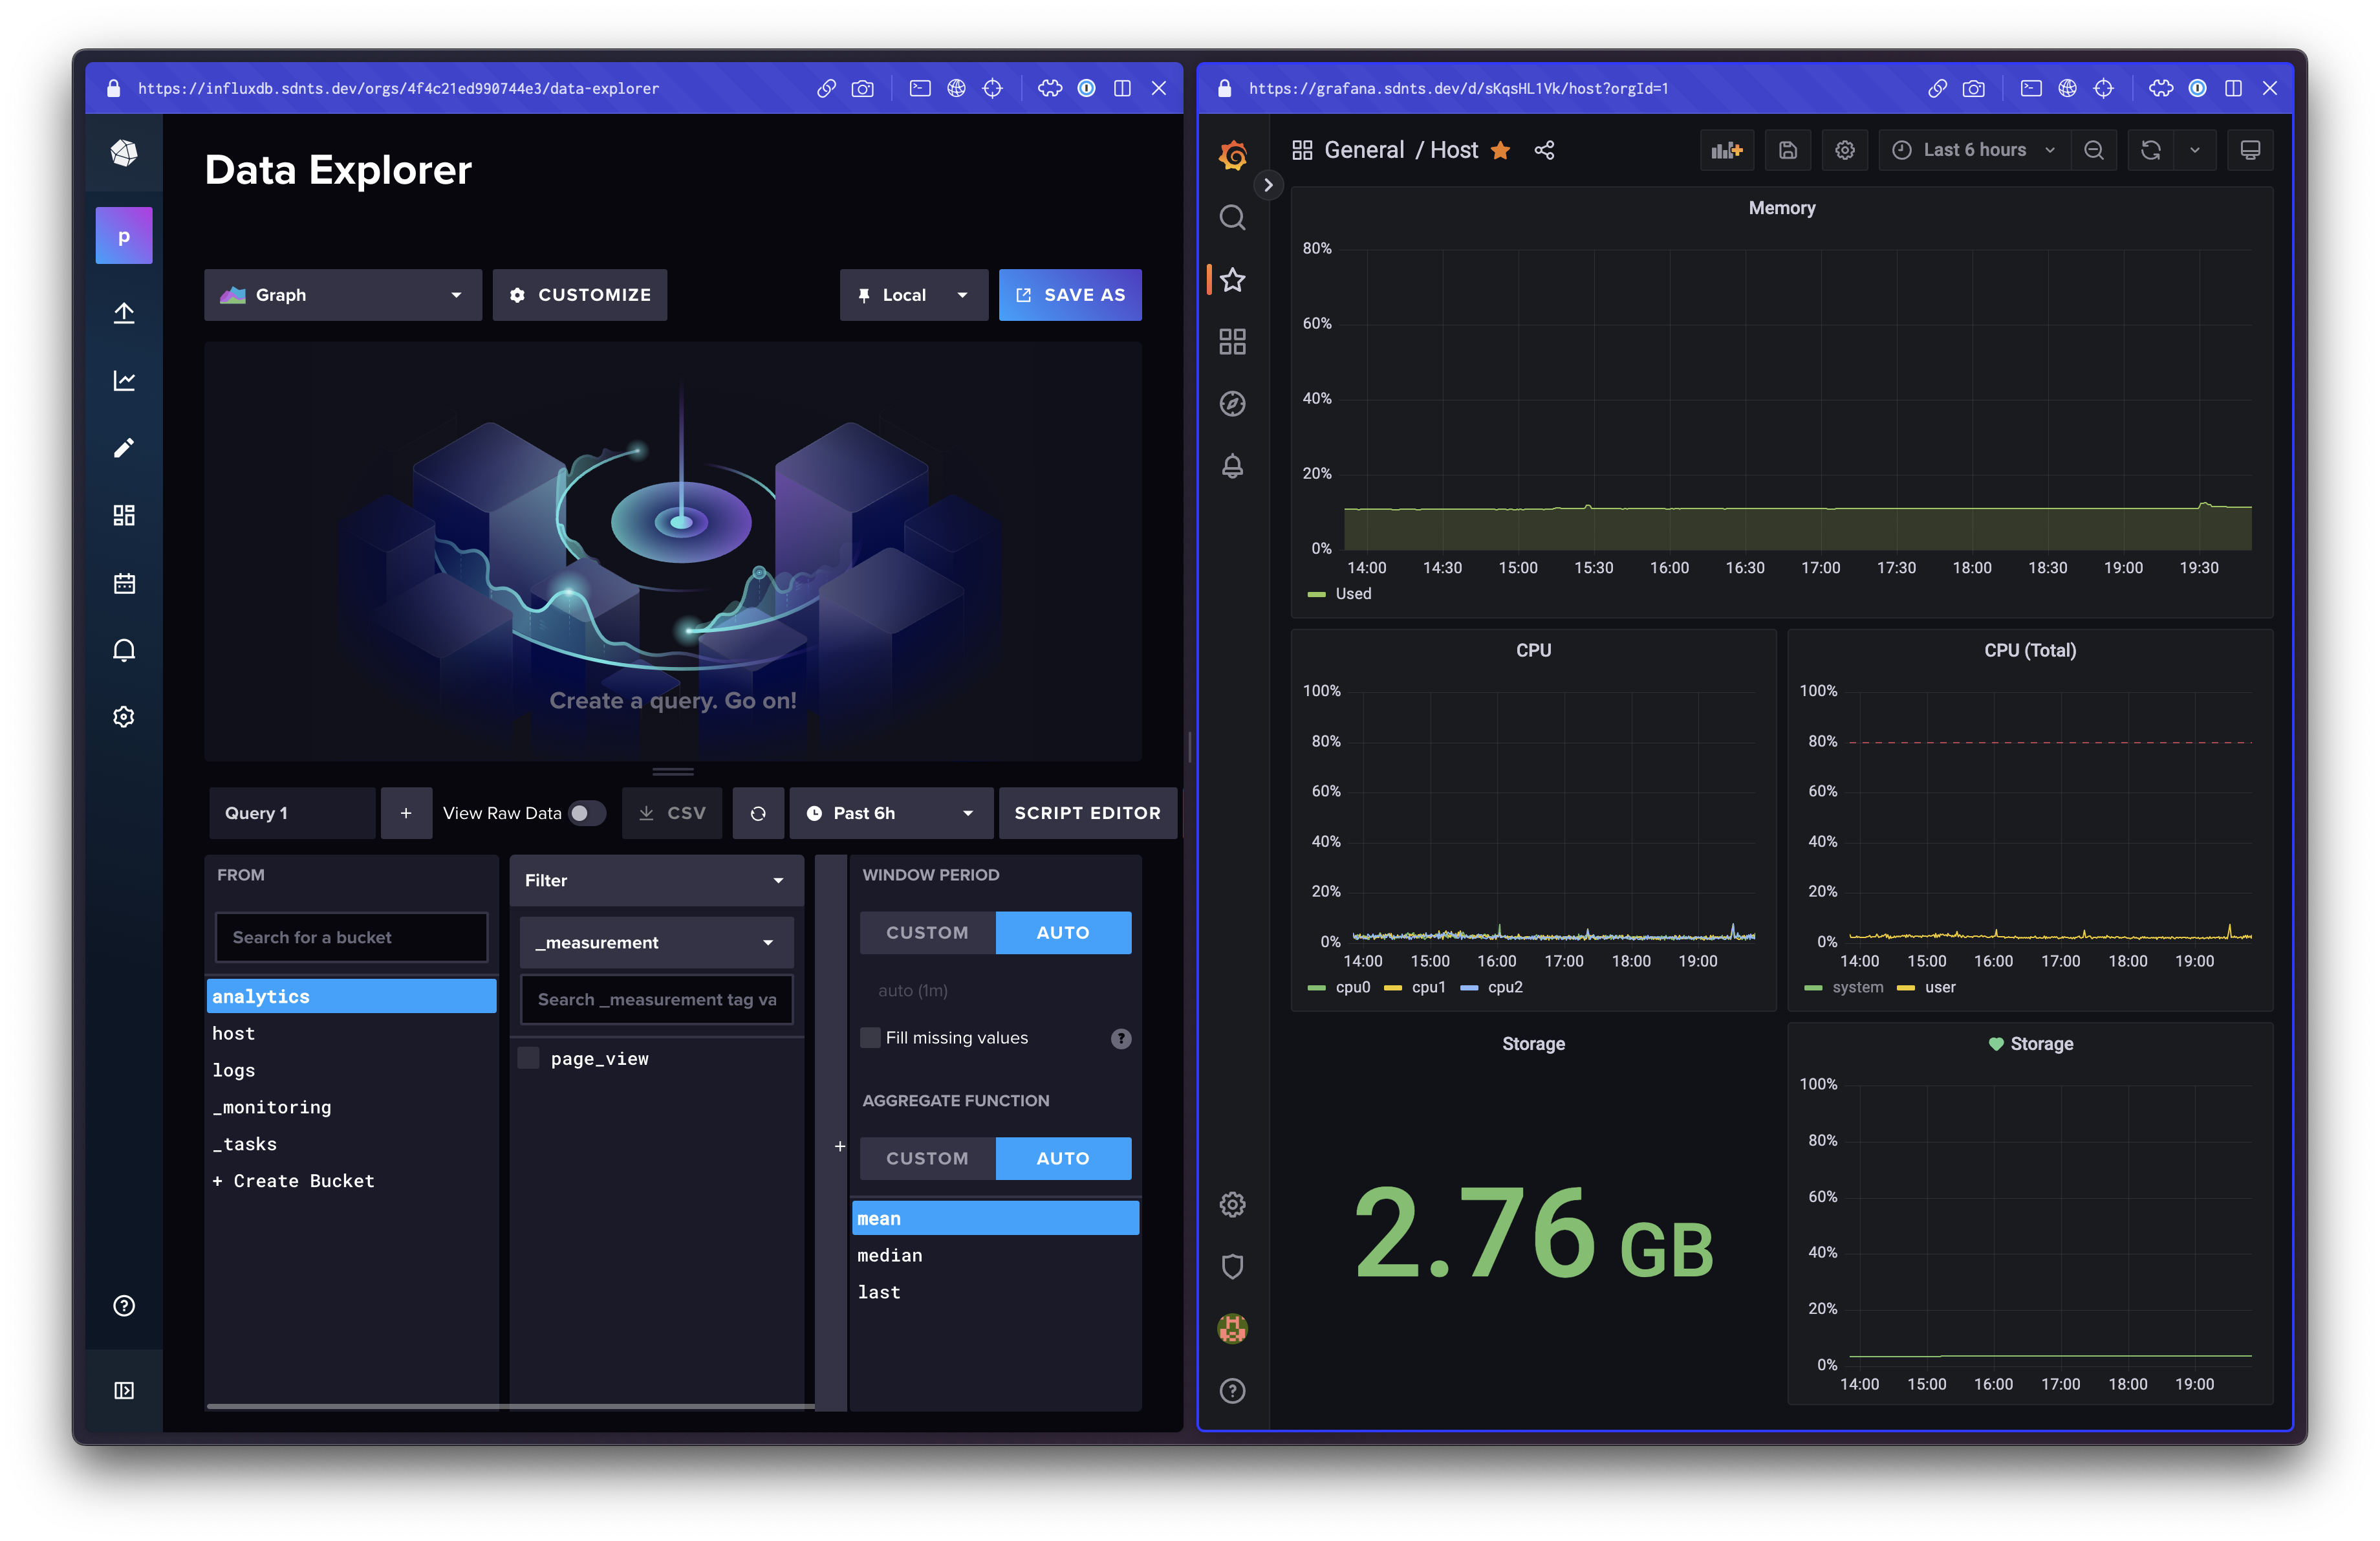
I installed Telegraf and configured the CPU, Memory & Disk input plugins, and the InfluxDB v2 output plugin. This meant that Telegraf would start pushing measurements about my VPS to InfluxDB, into a bucket of my choosing. This gave me tons of data to play around with. The Flux query language feels very intuitive to me, and I was able to generate some graphs very easily. Their visual Data Explorer is also a great way to learn Flux.
While I was at it, I also installed Grafana, the quintessential
visualization library. It also sets itself up as a systemd service, and I just
followed their docs
to set that up.
The tunnel
I had disabled ufw while I experimented with InfluxDB, Telegraf and Grafana, but
of course I couldn’t just leave those ports open. Enter cloudflared
and Cloudfare Access.
cloudflared establishes a direct line of communication from your VPS to Cloudflare’s
network. You can then set up CNAME records on a domain that will forward all traffic
from that CNAME to some port on your VPS. There are two clear advantages here:
- You don’t have to expose ports from your VPS to the public Internet. Putting your VPS behind Cloudflare gives it a pretty high level of security, so you can rest assured that your data is private and safe.
- You can host multiple services on the same IP without dabbling with port-forwarding and networking shenanigans yourself.
One disadvantage though is that you get pretty locked-in to Cloudflare. If that
is a concern, ngrok is an alternative to cloudflared that
might be worth looking into. I haven’t really dug into it personally though.
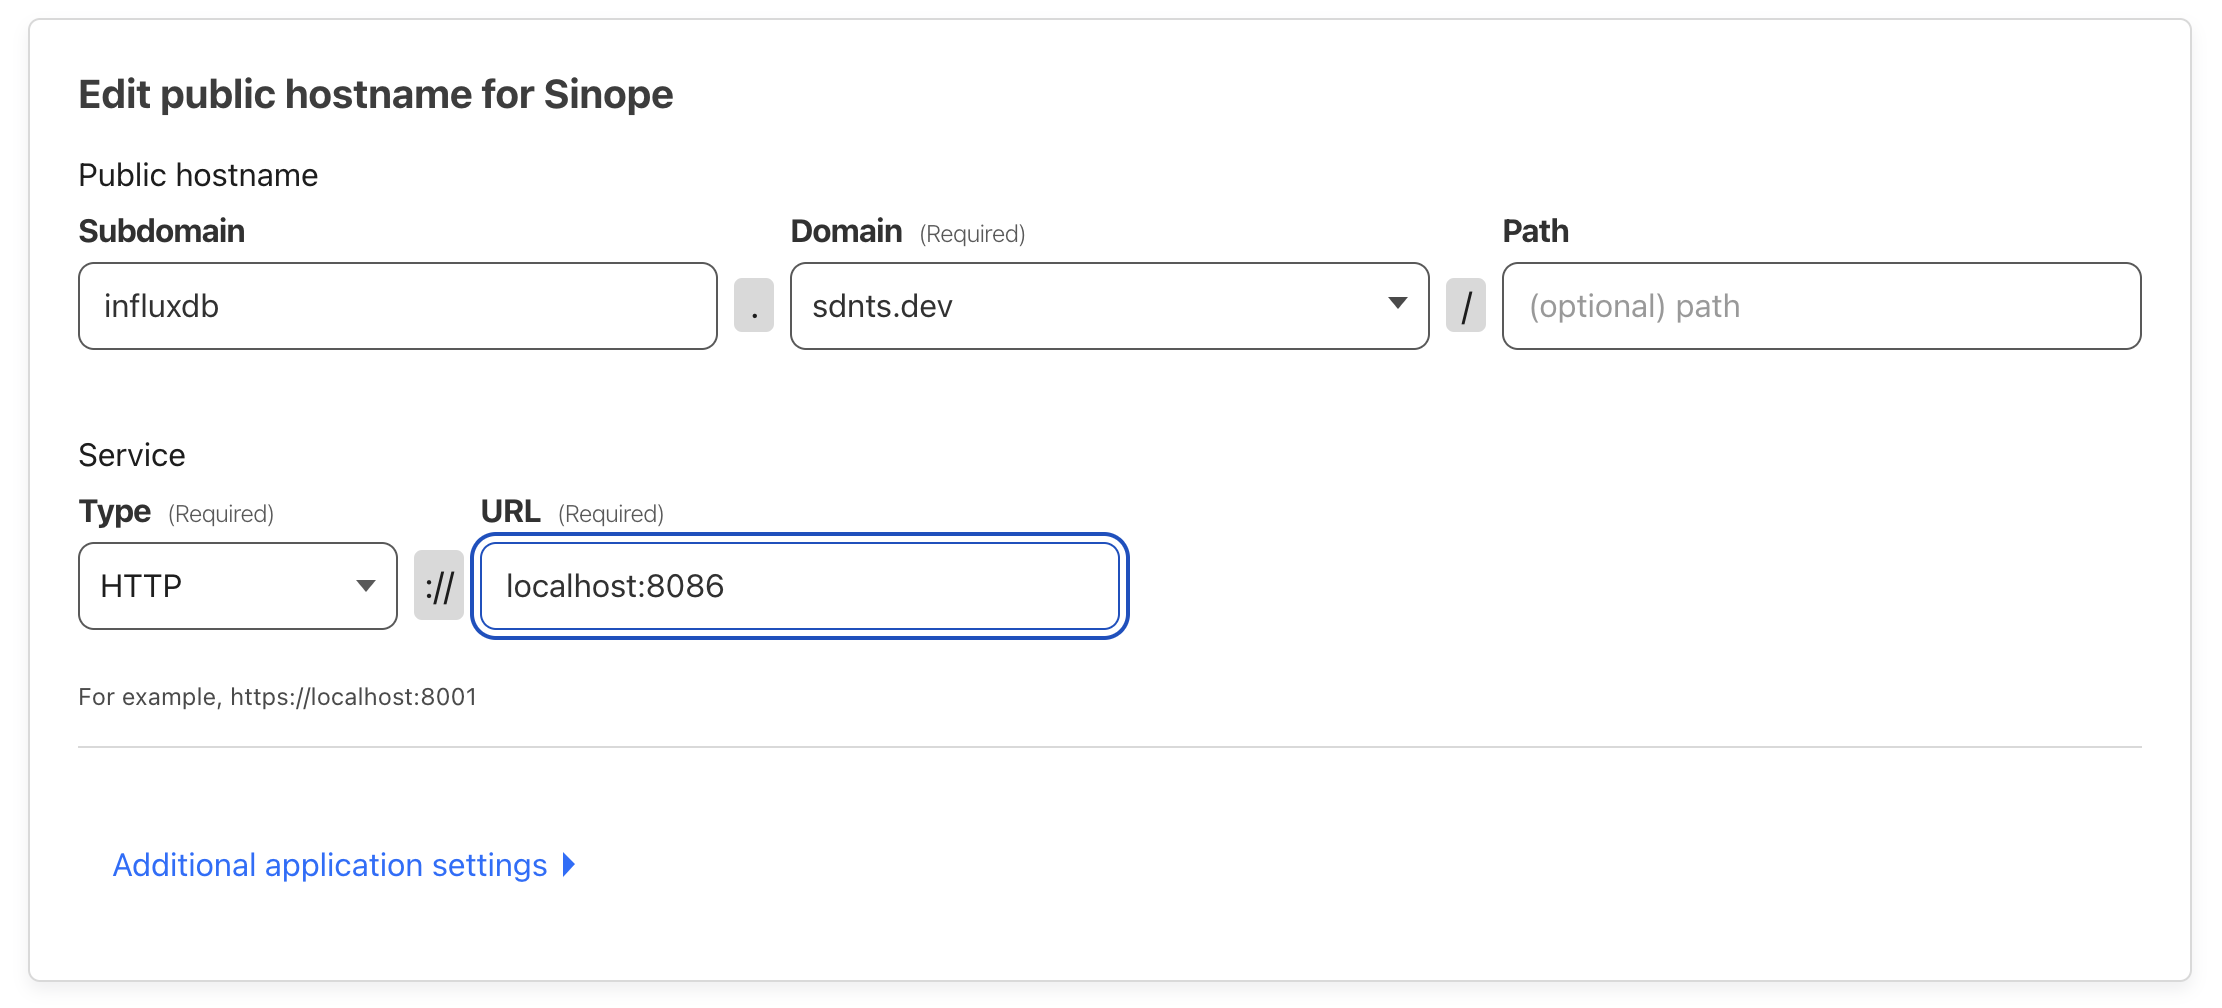
Setting up the cloudflared tunnel was just more of following instructions, and
it was surprisingly streamlined. I basically had https://influxdb.sdnts.dev
& https://grafana.sdnts.dev set up in minutes.
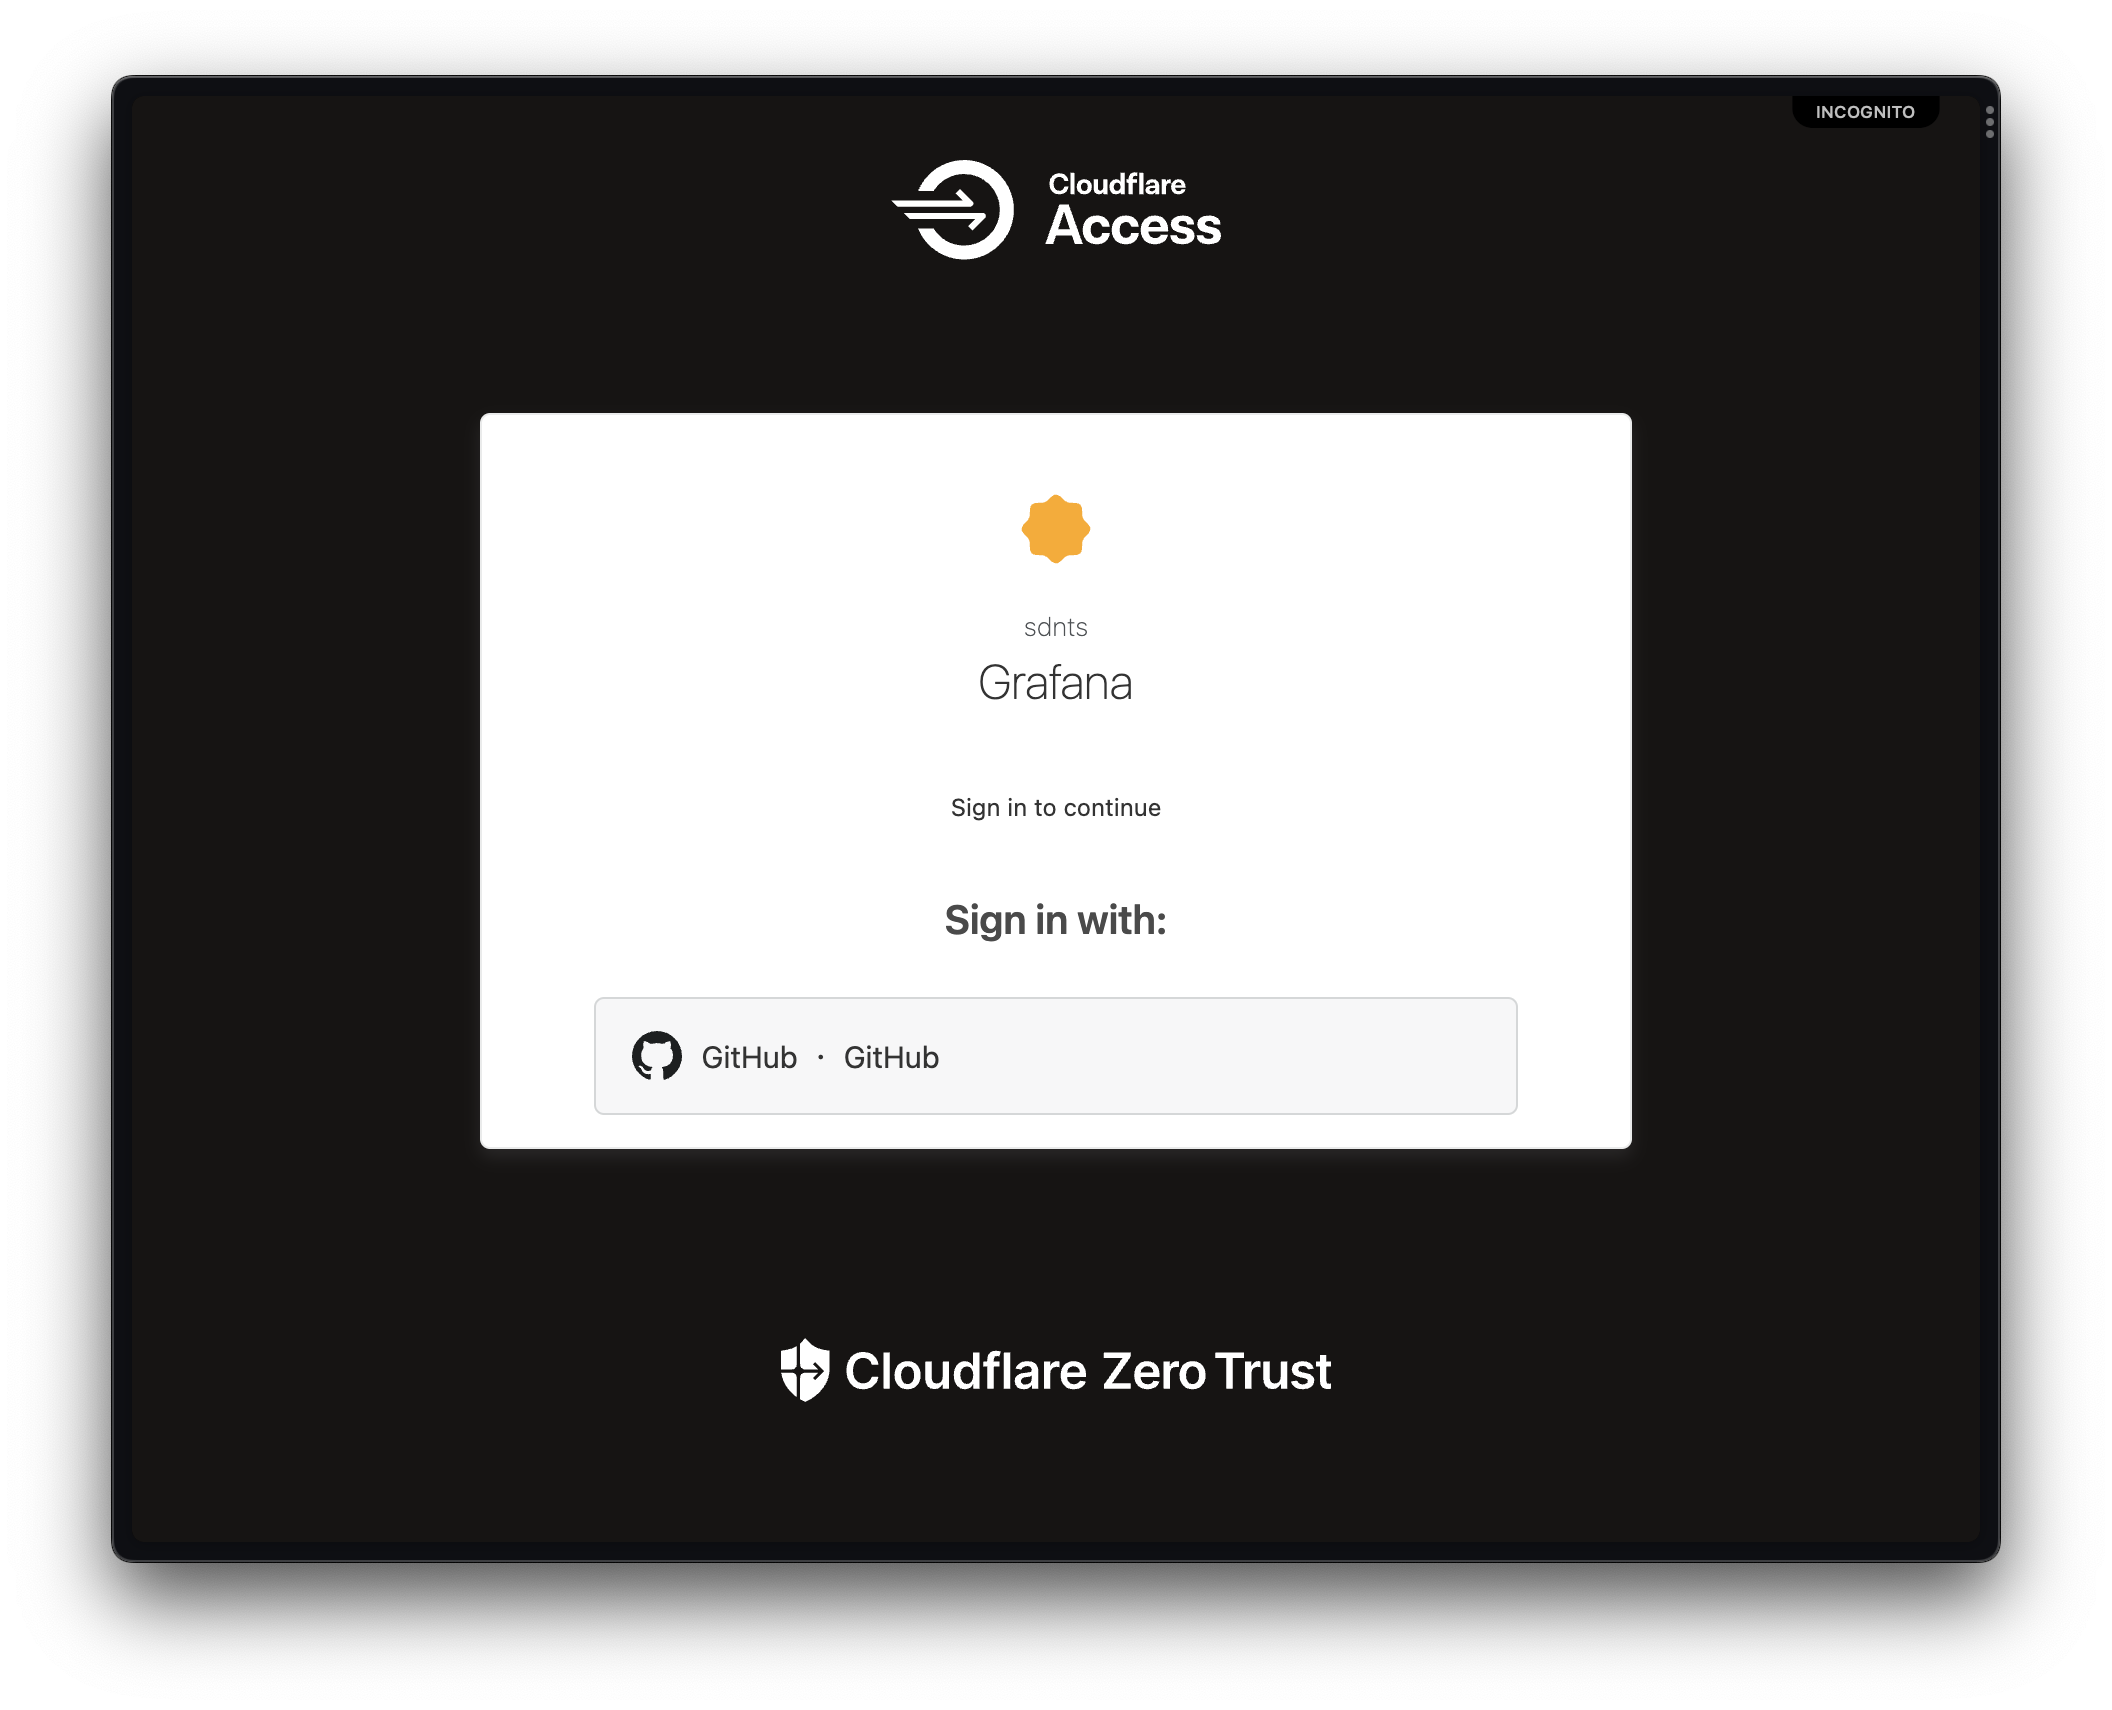
To keep Internet gremlins away from my (now public) Influx instance, I set up a
Cloudflare Access
policy. This took a while to make sense, but the end setup is very impressive. I
now have both my InfluxDB and Grafana CNAMEs behind GitHub authentication that
only accepts my email address.
I was super close now, time to send some actual page view data to InfluxDB!
The Worker
InfluxDB out-of-the-box exposes a POST /api/v2/write endpoint that can accept
data in InfluxDB’s line protocol,
which is just a fancy string. Something felt icky about sending data directly to
my database though, and I think it was the right gut reaction. I found Telegraf’s
InfluxDB v2 Listener
input plugin which was exactly what I needed. Sending my events to Telegraf meant
that it would batch a large influx (😬) of events to avoid bringing my database down.
Of course, I don’t expect a traffic spike like this, but something felt right about
routing all input to InfluxDB thorugh Telegraf. My output plugin was already set up,
so I literally just had to add a few lines to my Telegraf config file.
One more thing. My Telegraf instance was also behind Access for security, so I had to generate a service token to bypass my GitHub auth. I couldn’t just embed this token on a website though, so it was time to write a quick Worker. You can find the final Worker here if you’re impatient.
It’s pretty straight-forward stuff, for every request I get on this Worker, I schedule
a fetch to my Telegraf instance using waitUntil. Here’s the secret sauce: I don’t
have to wait for an OK from Telegraf because a few dropped analytics events are
no big deal. Because my Worker runs on Cloudflare’s edge, it is basically within
a few ms from most places on earth. So regardless of where I send these analytics
events from, they can be scheduled in a few ms as well. This is why you get this crazy RTT latency map:
Aaaand that’s it really. I can now hit my Worker and have a page_view event registered
on my InfluxDB instance. I set up an allowlist of origins that can send data, just
so any old webpage can’t just spam me. Cloudflare protects me from cURL-based
trolls.
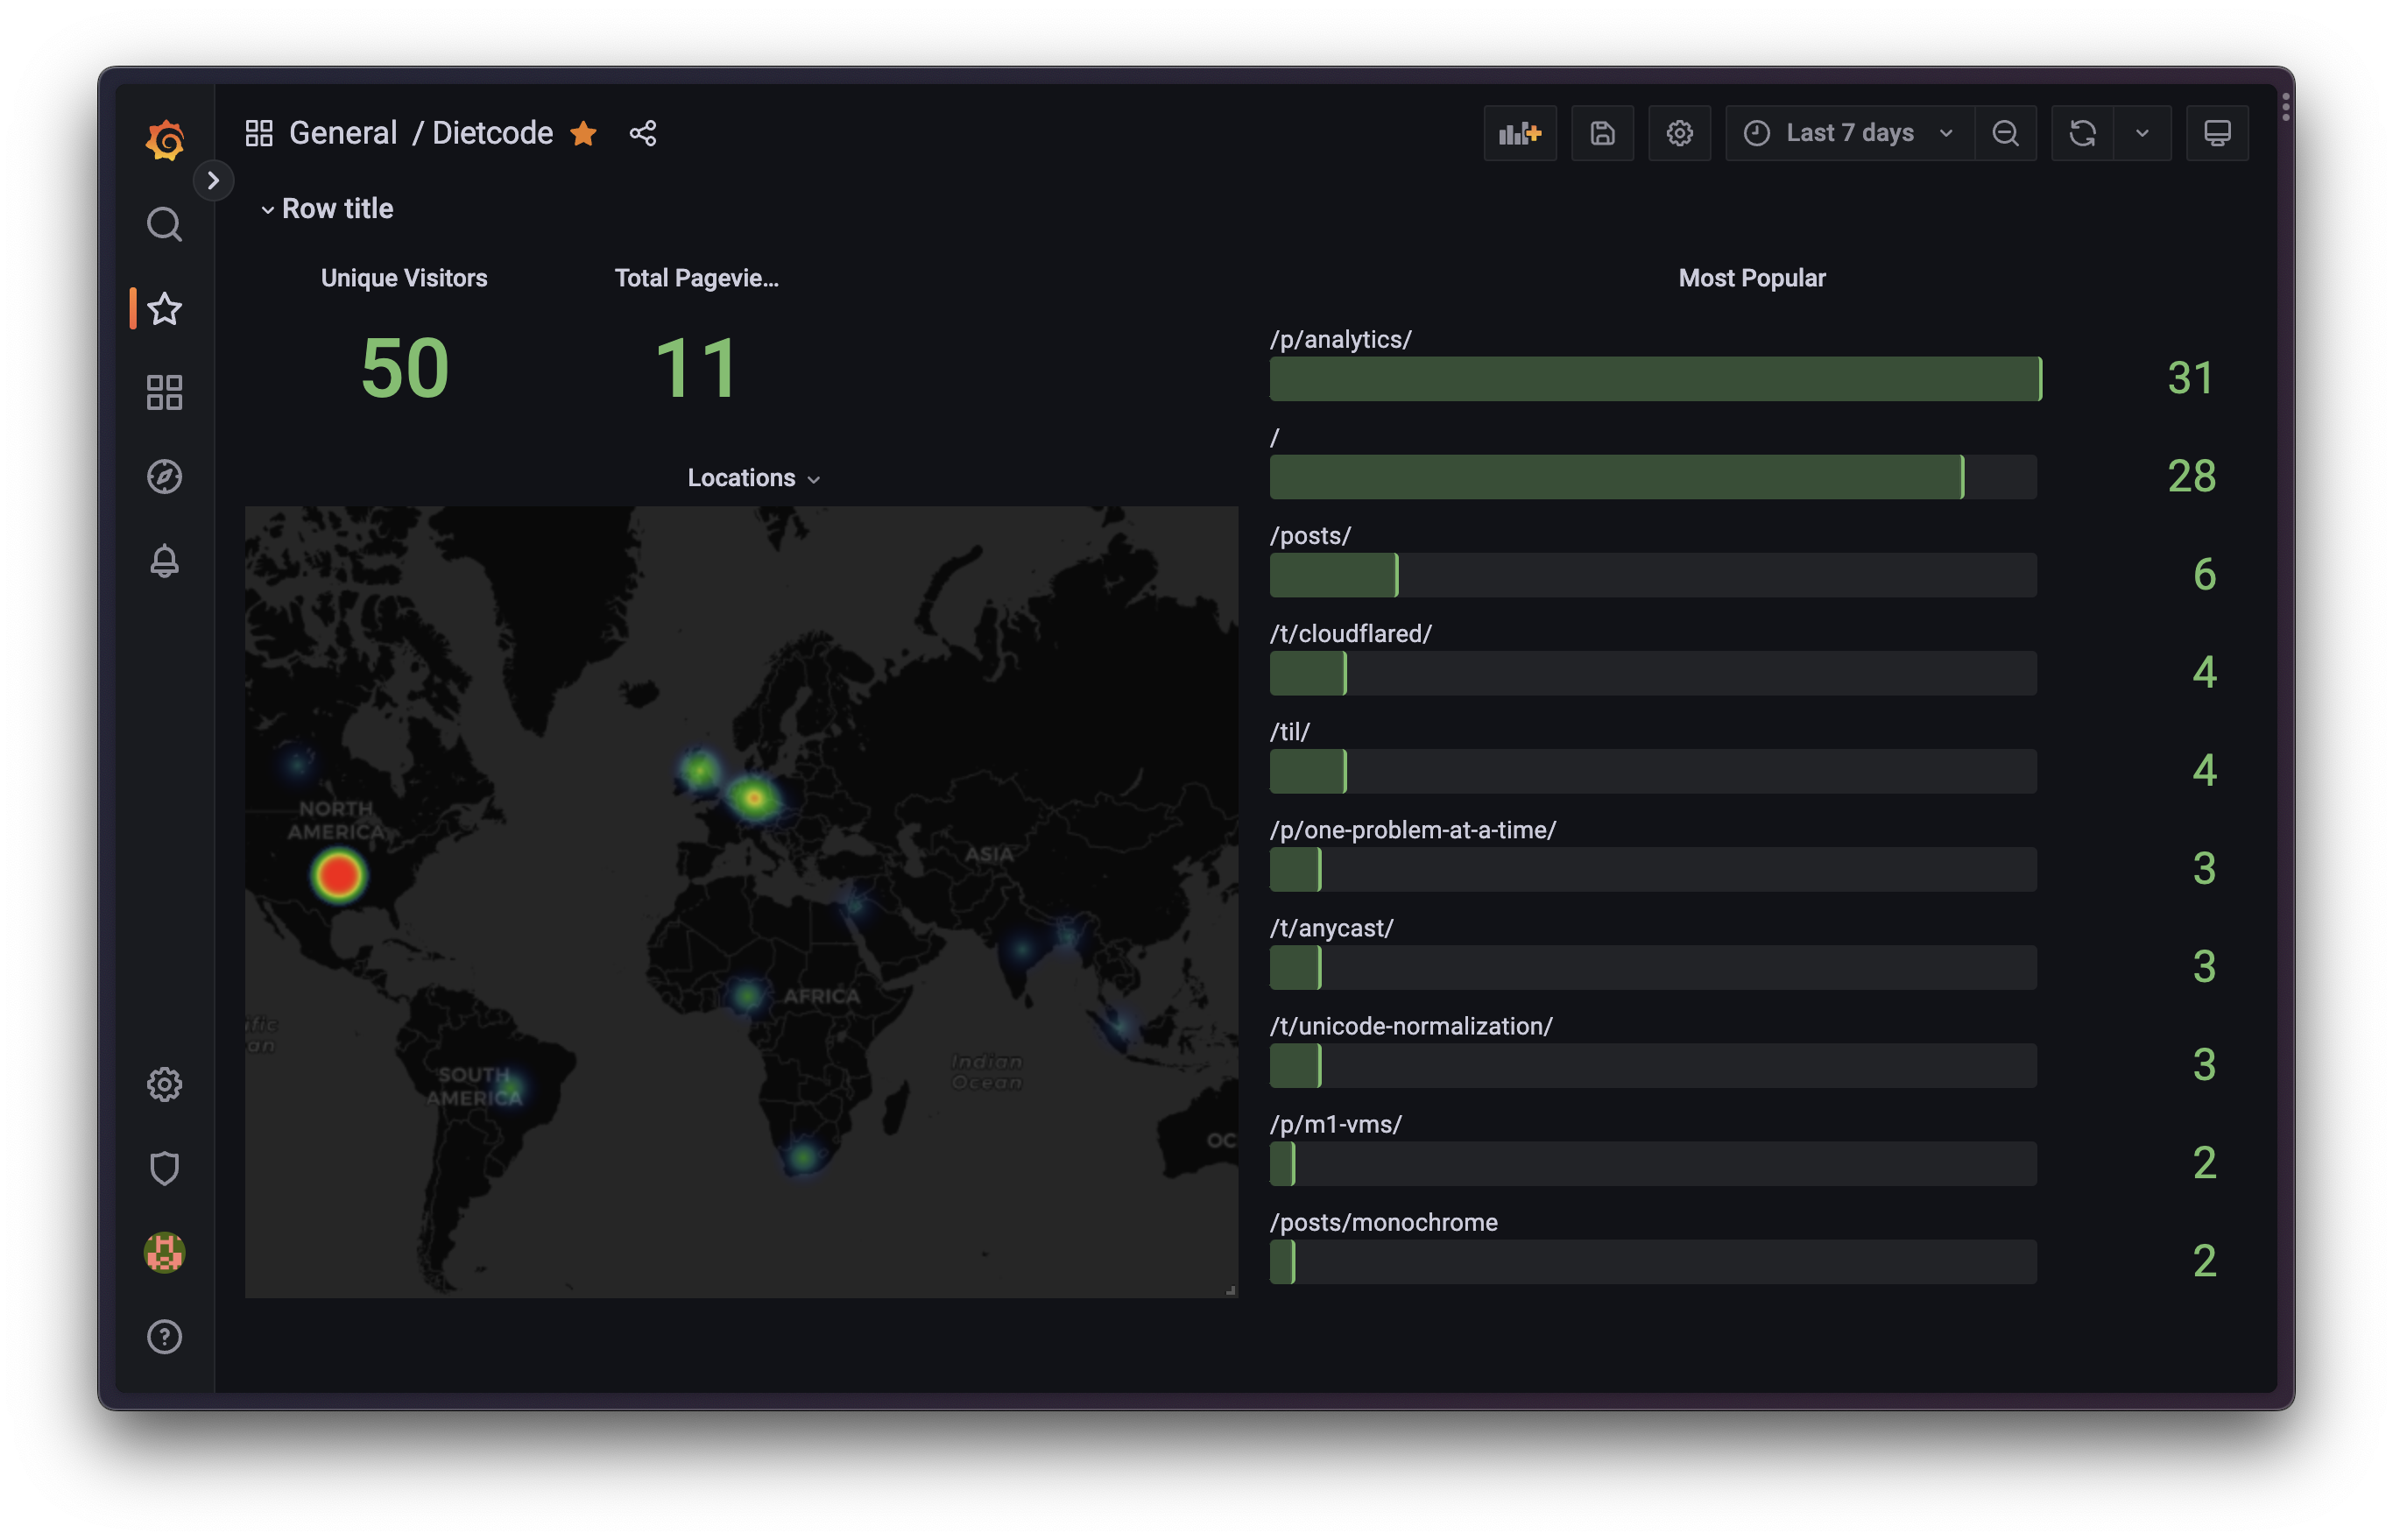
Useful analytics
This post wouldn’t be complete without a few Grafana dashboards to make analytics actually useful. What I cared about the most was seeing how many unique people a day were reading my blog. Every page load sends out an event to my ingest-worker. To calculate uniqueness, I SHA-256 hash a concatenated string of the date (to differentiate the same visitor across multiple days), the origin (to differentiate the same visitor across multiple sites), the IP address (to differentiate multiple visitors) & the user agent (also to differentiate multiple visitors who may have been sharing an IP address). This is a really clever way Plausible does it, so I just stole it (mostly).
For fun visualization purposes, I also send over the connecting IP address’ geographical location, but of course I “golden-rule”ed it by only sending over the country of the incoming connection. It’s so cool to see these light heat maps from different parts of the world!
Conclusion
This was a super fun weekend. I now have an (over-engineered) pipeline for any kind of time series data I want to measure, and I’m so glad I can just throw it at a URL with the confidence that things will “just work”.
I know I skipped past the actual “configuration”, but if you’re trying to build something similar and get stuck, please shoot me a message on Twitter or Mastodon and I’d be happy to help you out / send over my config files!